#> Registered S3 method overwritten by 'textutils':
#>   method             from
#>   toLatex.data.frame exams
In this type of task, the candidate matches rows with columns in a table. This format is often used when multiple questions need to be displayed concisely. Table tasks are highly versatile and are ideal for creating both single-choice and multiple-choice questions.
Minimum version
A minimum template is automatically created when you initiate an rqti
project through RStudio. Alternatively, it can be added by clicking on
New file -> R Markdown -> From Template. The
rqti templates end with rqti. Here we look
at the templates table (simple) and
table (complex).
The minimum you need to provide is the type: table in
the YAML section and a table in a section called
#question:
---
type: table
knit: rqti::render_qtijs
---
# question
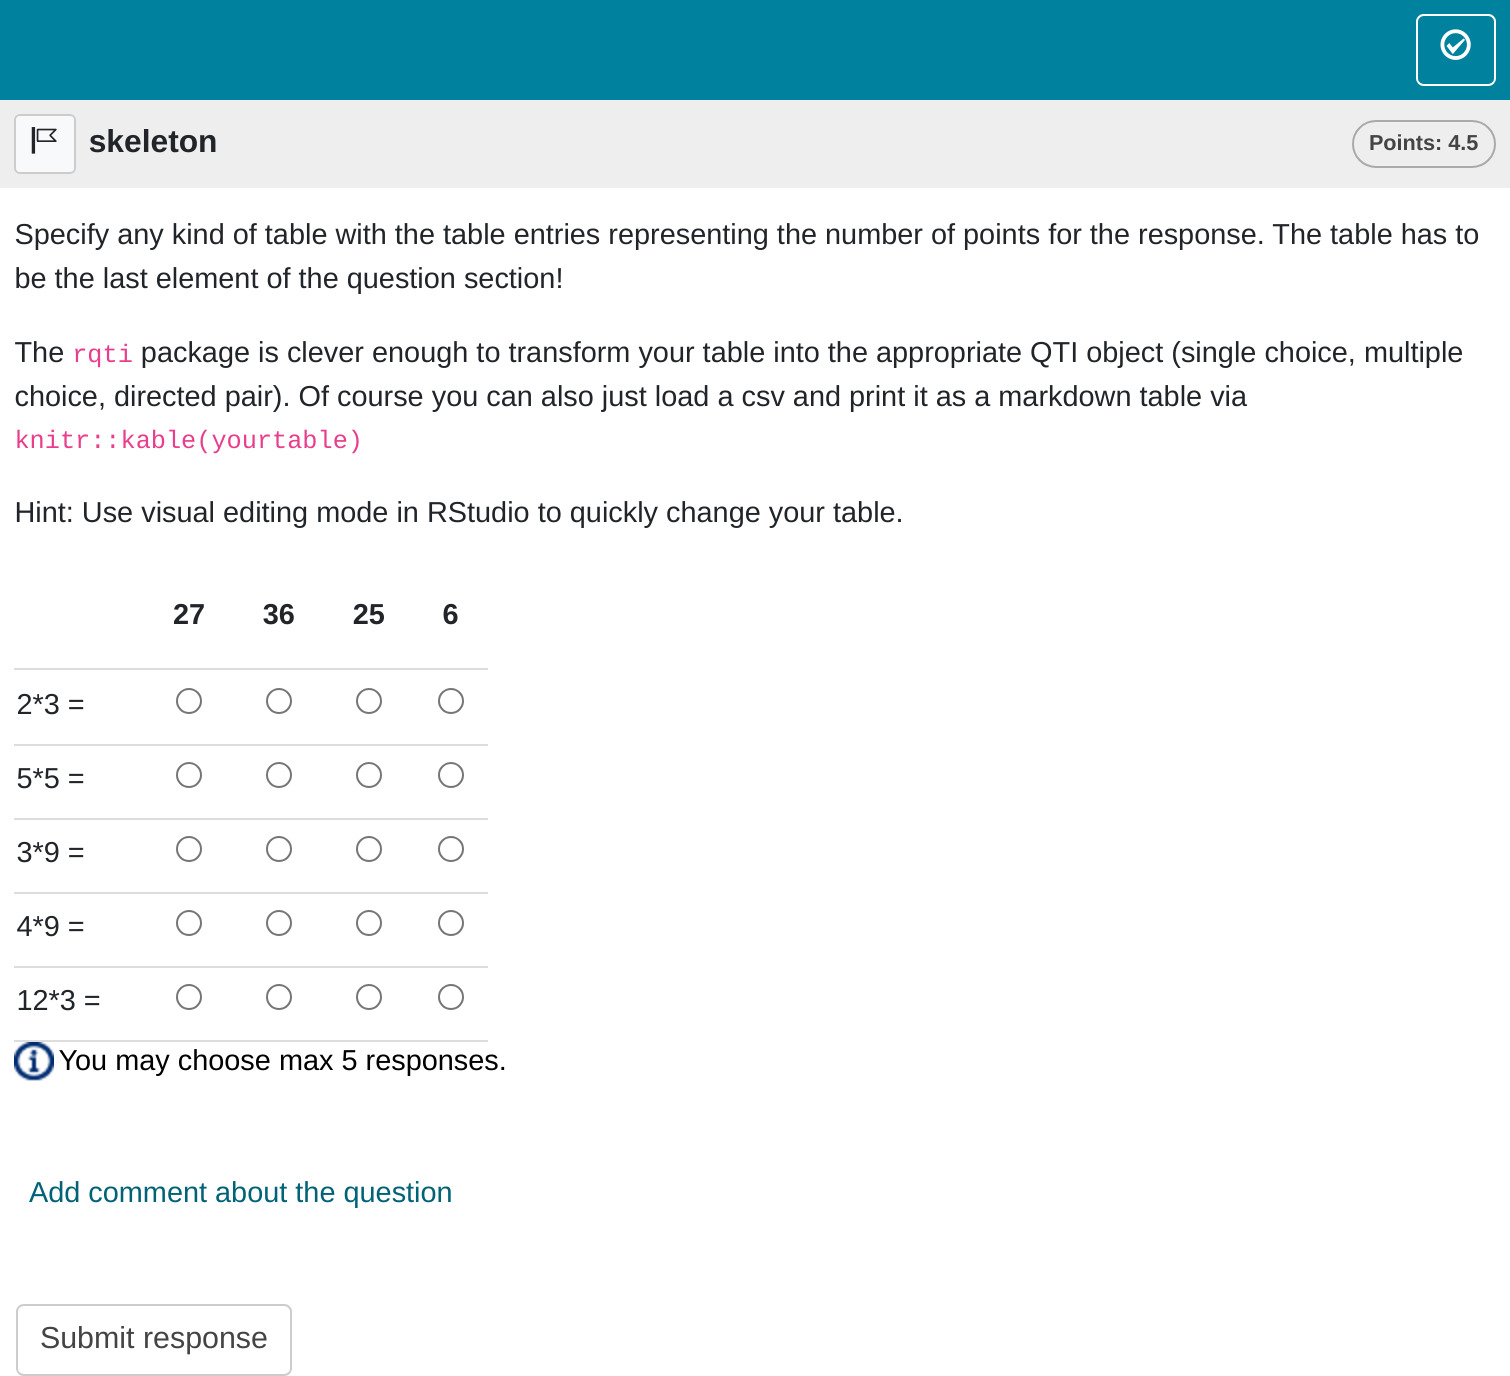
Specify any kind of table with the table entries representing the number of
points for the response. The table has to be the last element of the question
section!
The `rqti` package is clever enough to transform your table into the appropriate
QTI object (single choice, multiple choice, directed pair). Of course you can
also just load a csv and print it as a markdown table via
`knitr::kable(yourtable)`
Hint: Use visual editing mode in RStudio to quickly change your table.
| |27|36 |25| 6 |
|------|--|---|--|---|
|4*9 = |0 |0.5|0 | 0 |
|3*9 = |1 |0 |0 | 0 |
|5*5 = |0 |0 |1 | 0 |
|2*3 = |0 |0 |0 | 1 |
|12*3 =|0 |1 |0 | 0 |
# feedback
Provide your feedback here. For tables it is difficult to provide useful
feedback because there are usually many questions. But most learning management
systems will at least show which answers are correct and incorrect.Clicking the Knit-Button will produce :

Alternatively, change the knit parameter to
knit: rqti::render_opal (see article Working with the OPAL API) to upload to opal
directly, producing :
In the Rmd file, table entries indicate the points awarded for each
response. Any positive number is considered correct. You can also assign
negative numbers, which will reduce the total score, but the overall
score will never go below zero. You can specify the number of correct
responses per row and column as needed, which typically influences how
the table is presented. For example, there are special table
configurations where only one row is correct per column, and vice versa.
The rqti package handles these cases automatically, so no
additional steps are required on your part.
However, it is important to note that if your table represents a
directed pair, the rqti package will automatically convert
it into a directed pair task. If you prefer to keep it as a standard
table, use as_table: true in the YAML section of your Rmd
file.
The overall points for the task are calculated as the sum of the positive table entries.
Of course you can also just load a csv and print it as a markdown
table via knitr::kable(yourtable). Just do not forget that
the table has to be the last element of the question section.
In this example, a feedback section was also included. While feedback is optional, it is generally beneficial to provide some explanation to students. However, offering detailed feedback can be challenging for table tasks, especially when questions are presented in random order. Most learning management systems at least indicate which answers are correct or incorrect, so feedback can be more general, focusing on the overall topic.
More control
If you want to have more fine-grained control, consider the Rmd
template table (complex), which uses more YAML
attributes.
---
type: table
knit: rqti::render_qtijs
identifier: TOPIC1_Q001 # think twice about this id for later data analysis!
title: A meaningful title that can be displayed in the LMS
shuffle_cols: false
shuffle_rows: true
abbr_id: true
---

# question

Specify any kind of table with the table entries representing the number of
points for the response. The table has to be the last element of the question
section!

The `rqti` package is clever enough to transform your table into the appropriate
QTI object (single choice or multiple choice). Of course you can also just load
a csv and print it as a markdown table via `knitr::kable(yourtable)`

Use visual editing mode in RStudio to quickly change your table.

|      |27|36 |25| 6 |
|------|--|---|--|---|
|4*9 = |0 |0.5|0 | 0 |
|3*9 = |1 |0  |0 | 0 |
|5*5 = |0 |0  |1 | 0 |
|2*3 = |0 |0  |0 | 1 |
|12*3 =|0 |1  |0 | 0 |


# feedback

Provide your feedback here. For tables it is difficult to provide useful
feedback because there are usually many questions. But most learning management
systems will at least show which answers are correct and incorrect.
Which, in OPAL, renders as :
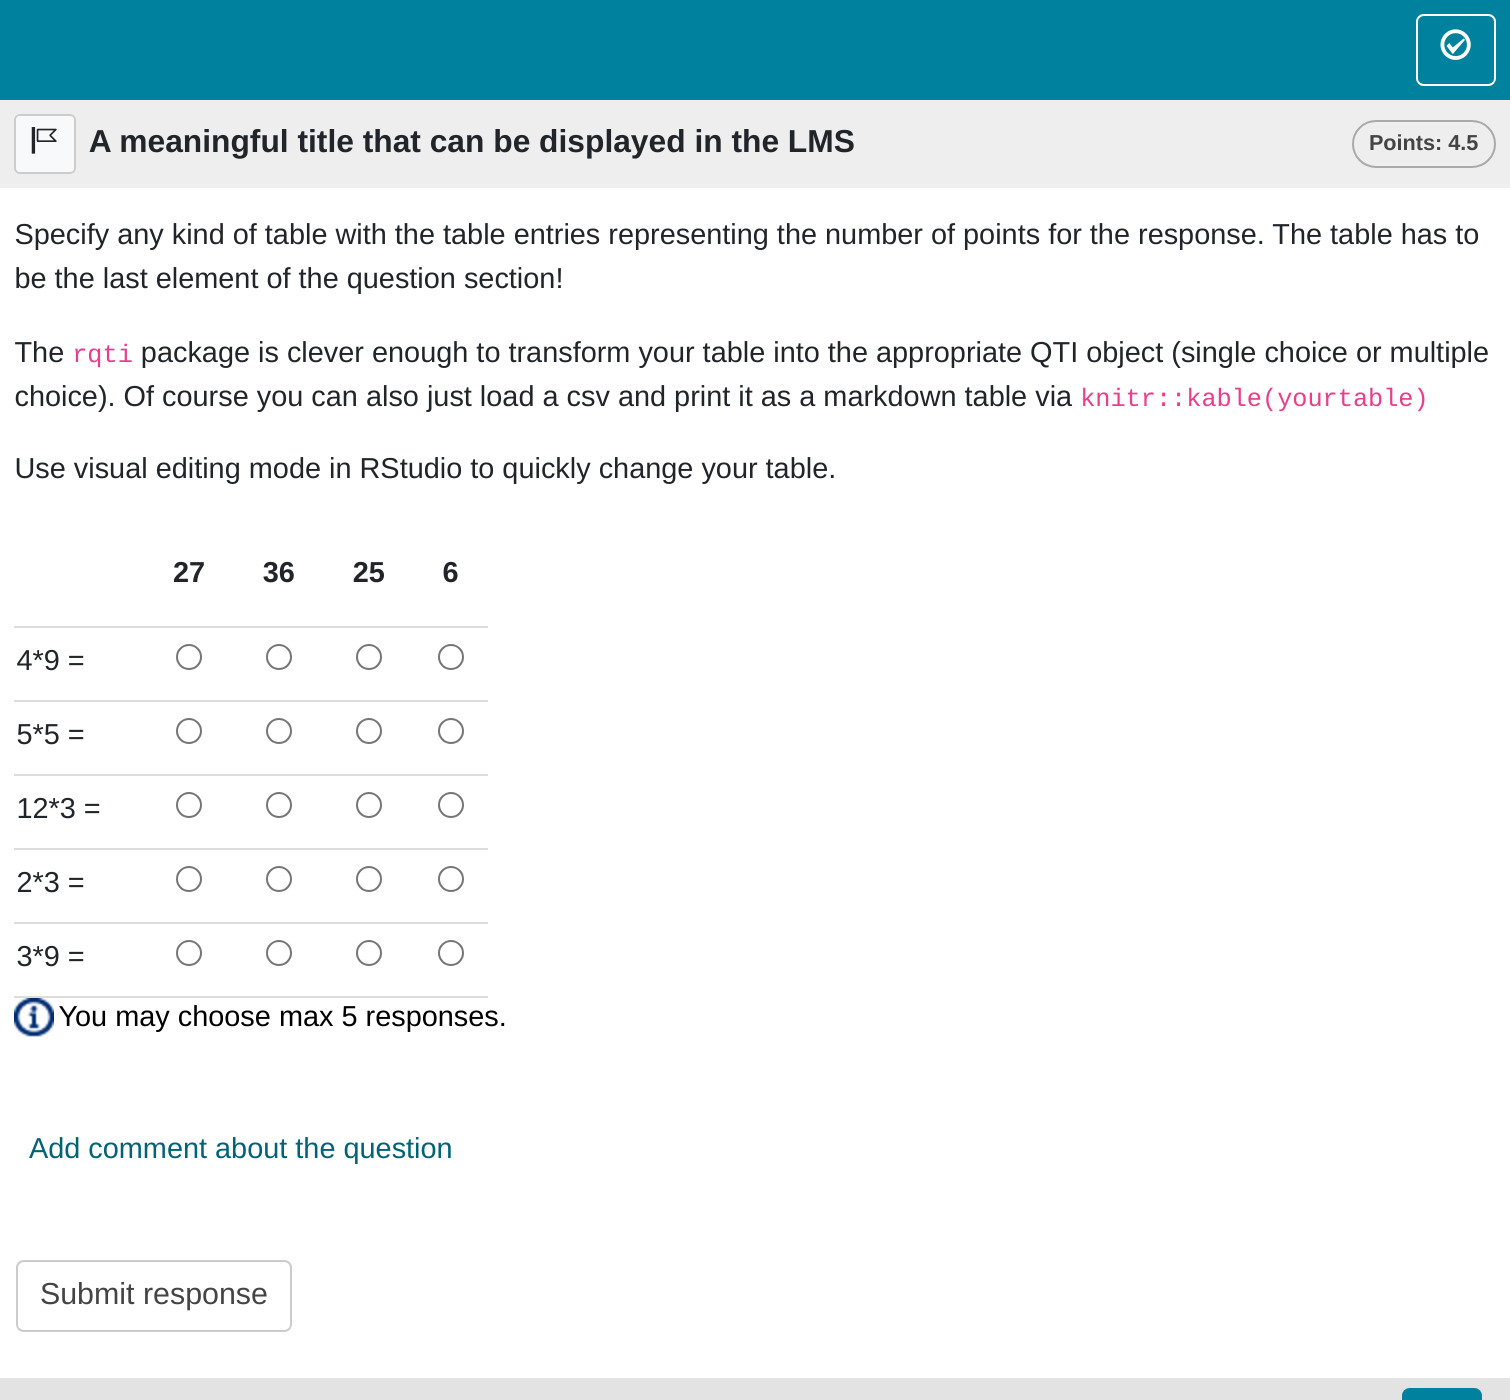
You can see that the order of the columns is now the same as in the source table.
YAML attributes
identifier
This is the ID of the task, useful for later data analysis of results. The default is the file name. If you are doing extensive data analysis later on it makes sense to specify a meaningful identifier. In all other cases, the file name should be fine.
title
Title of the task. Can be displayed to students depending on the learning management system settings. Default is the file name.
shuffle
If true (the default), randomizes the order of rows and
columns. Only in rare occasions it makes sense to have a strict order of
elements (setting shuffle to false). Overwrites
shuffle_rows and shuffle_cols.
abbr_id
Defines the use of an abbreviation as a way to generate row and column identifiers. Explained in more detail in the section Managing identifiers.
Feedback
Feedback can be provided with the section
- # feedback (general feedback, displayed every time, without conditions)
- # feedback+ (only provided if student reaches all points)
- # feedback- (only provided if student does not reach all points)
Managing identifiers
The identifiers for rows and columns are valuable for later data analysis. If you plan to conduct extensive analysis, it is beneficial to assign meaningful and easily recognizable identifiers.
Currently, there are two methods for creating row and column identifiers:
-
Default Method: By default,
rqtigenerates identifiers in the formatrow_1,row_2, …,row_N, andcol_1,col_2, …,col_N. -
Abbreviation Method: By setting
abbr_id: truein the YAML section of your Rmd file,rqtigenerates identifiers by combining the first word of a row or column element with an abbreviation of the remaining text. For example, the element “Mean Value Theorem for Integrals” would be shortened to “Mean_VTfI”. If a row or column name starts with digits,rqtiautomatically adds a “row” or “col” prefix, as identifiers cannot begin with a number. Special characters are also removed.
After experimenting with various approaches, we settled on these straightforward methods. If you require more control over the identifiers, please open an issue on GitHub: https://github.com/shevandrin/rqti/issues. We are open to reconsidering the available options.
Some advice on table tasks
Table tasks are forced choice tasks, so they suffer from the sample problems as single choice and multiple choice tasks. The advantage of table tasks is that they are easy so manage (e.g. in csv-tables) and many questions can be asked at once, using little space.